
ملف:1951- Percent of record temperatures that are cold or warm records.svg

حجم معاينة PNG لذلك الملف ذي الامتداد SVG: 800 × 560 بكسل. الأبعاد الأخرى: 320 × 224 بكسل | 640 × 448 بكسل | 1٬024 × 717 بكسل | 1٬280 × 896 بكسل | 2٬560 × 1٬792 بكسل | 1٬000 × 700 بكسل.
الملف الأصلي (ملف SVG، أبعاده 1٬000 × 700 بكسل، حجم الملف: 8 كيلوبايت)
| هذا ملف من ويكيميديا كومنز. معلومات من صفحة وصفه مبينة في الأسفل. كومنز مستودع ملفات ميديا ذو رخصة حرة. |
ملخص
| الوصف |
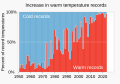
English: Chart showing percent of record temperatures that are cold records or warm records
|
||
| التاريخ | |||
| المصدر | عمل شخصي | ||
| المؤلف | RCraig09 |

Related files
-
 01 January - Percent of global area at temperature records - Global warming - NOAA.svg
(January data) -
 02 February - Percent of global area at temperature records - Global warming - NOAA.svg
(February data) -
 03 March - Percent of global area at temperature records - Global warming - NOAA.svg
(March data) -
 04 April - Percent of global area at temperature records - Global warming - NOAA.svg
(April data) -
 05 May - Percent of global area at temperature records - Global warming - NOAA.svg
(May data) -
 06 June - Percent of global area at temperature records - Global warming - NOAA.svg
(June data)


-
 07 July - Percent of global area at temperature records - Global warming - NOAA.svg
(July data) -
 08 August - Percent of global area at temperature records - Global warming - NOAA.svg
(August data) -
 09 September - Percent of global area at temperature records - Global warming - NOAA.svg
(September data) -
 10 October - Percent of global area at temperature records - Global warming - NOAA.svg
(October data) -
 11 November - Percent of global area at temperature records - Global warming - NOAA.svg
(November data) -
 12 December - Percent of global area at temperature records - Global warming - NOAA.svg
(December data)


-
 1951+ Percent of global area at temperature records - Seasonal comparison - NOAA.svg
Seasonal comparison -
 1951 - Percent of global area at temperature records (monthly) - Global warming - NOAA.svg
All months scatterplot/dot plot -
 1951- RATIO of new record warm temperatures to new record cold temperatures (monthly) - Global warming.svg
Ratios scatterplot/dot plot (monthly) -
 1951- Percent of record temperatures that are cold or warm records.svg
 -
 1951- Warm and cold record temperatures - bar chart.svg

_-_Global_warming_-_NOAA.svg)
_-_Global_warming.svg)


ترخيص
أنا، صاحب حقوق التأليف والنشر لهذا العمل، أنشر هذا العمل تحت الرخصة التالية:
هذا الملفُّ مُرخَّصٌ برخصة المشاع الإبداعي الدَّوليَّة المُلزِمة بنسب العمل إلى مُؤَلِّفه وبترخيص المُشتقَّات بالمثل 4.0.
- يحقُّ لك:
- مشاركة العمل – نسخ العمل وتوزيعه وبثُّه
- إعادة إنتاج العمل – تعديل العمل
- حسب الشروط التالية:
- نسب العمل إلى مُؤَلِّفه – يلزم نسب العمل إلى مُؤَلِّفه بشكل مناسب وتوفير رابط للرخصة وتحديد ما إذا أجريت تغييرات. بالإمكان القيام بذلك بأية طريقة معقولة، ولكن ليس بأية طريقة تشير إلى أن المرخِّص يوافقك على الاستعمال.
- الإلزام بترخيص المُشتقات بالمثل – إذا أعدت إنتاج المواد أو غيرت فيها، فيلزم أن تنشر مساهماتك المُشتقَّة عن الأصل تحت ترخيص الأصل نفسه أو تحت ترخيص مُتوافِقٍ معه.
تاريخ الملف
اضغط على زمن/تاريخ لرؤية الملف كما بدا في هذا الزمن.
| زمن/تاريخ | صورة مصغرة | الأبعاد | مستخدم | تعليق | |
|---|---|---|---|---|---|
| حالي | 15:33، 18 يونيو 2024 | | 1٬000 × 700 (8 كيلوبايت) | Jojit fb | File uploaded using svgtranslate tool (https://svgtranslate.toolforge.org/). Added translation for tl. |
| 07:34، 17 يونيو 2024 |  | 1٬000 × 700 (8 كيلوبايت) | GinawaSaHapon | File uploaded using svgtranslate tool (https://svgtranslate.toolforge.org/). Added translation for tl. | |
| 21:41، 25 يناير 2024 |  | 1٬000 × 700 (6 كيلوبايت) | RCraig09 | Version 2: change shade of blue to correspond to change in related File:1951- Warm and cold record temperatures - bar chart.svg | |
| 20:24، 24 يناير 2024 |  | 1٬000 × 700 (6 كيلوبايت) | RCraig09 | Uploaded own work with UploadWizard |
استخدام الملف
الصفحة التالية تستخدم هذا الملف:
الاستخدام العالمي للملف
الويكيات الأخرى التالية تستخدم هذا الملف:
- الاستخدام في en.wikipedia.org
- الاستخدام في tl.wikipedia.org