
ملف:Gaia’s Hertzsprung-Russell diagram ESA393151.jpg

الملف الأصلي (2٬480 × 3٬754 بكسل حجم الملف: 1٫46 ميجابايت، نوع MIME: image/jpeg)
| هذا ملف من ويكيميديا كومنز. معلومات من صفحة وصفه مبينة في الأسفل. كومنز مستودع ملفات ميديا ذو رخصة حرة. |


ملخص
| الوصف |
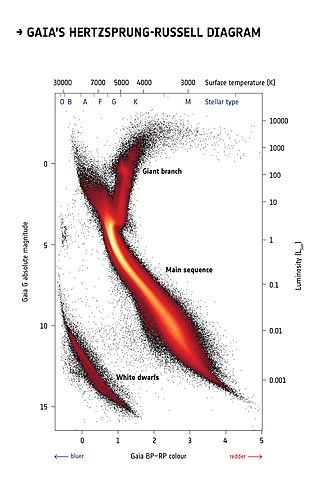
English: More than four million stars within five thousand light-years from the Sun are plotted on this diagram using information about their brightness, colour and distance from the second data release from ESA’s Gaia satellite. It is known as a Hertzsprung-Russell diagram after the astronomers who devised it in the early 20th century, and it is a fundamental tool to study populations of stars and their evolution.
This Hertzsprung-Russell diagram, obtained by a selection of stars in Gaia’s second release catalogue, is the most detailed to date made by mapping stars over the entire sky, containing roughly a hundred times more stars thanthe one obtained using data from ESA’s Hipparcos mission, the predecessor of Gaia, in the 1990s. This new diagram contains so much highly accurate information that astronomers have been able to identify fine details that were never before seen. The Hertzsprung-Russell diagram can be imagined as a stellar family portrait: stars are plotted according to their colour (on the horizontal axis) and brightness (on the vertical axis) and are grouped in different regions of the diagram depending mainly on their masses, chemical composition, ages, and stages in the stellar life cycle. Information about stellar distances is fundamental to calculate the true brightness, or absolute magnitude, of stars. Brighter stars are shown in the top part of the diagram, while fainter stars are in the lower part. Bluer stars, which have hotter surfaces, are on the left, and redder stars, with cooler surfaces, on the right. The colour scale in this image does not represent the colour of stars but is a representation of how many stars are plotted in each portion of the diagram: black represents lower numbers of stars, while red, orange and yellow correspond to increasingly higher numbers of stars. The large diagonal stripe across the centre of the graph is known as the main sequence. This is where fully-fledged stars that are generating energy by fusing hydrogen into helium are found. Massive stars, which have bluer or whiter colours, are found in the upper left end of the main sequence, while intermediate-mass stars like our Sun, characterised by yellow colours, are located mid-way. Redder, low-mass stars are found towards the lower right. As stars age they swell up, becoming brighter and redder. Stars experiencing this are shown on the diagram as the vertical arm leading off the main sequence and turning to the right. This is known as the red giant branch. While the most massive stars swell into red giants and explode as powerful supernovae, stars like our Sun end their days in a less spectacular fashion, eventually turning into white dwarfs – the hot cores of dead stars. These are found in the lower left of the diagram. The huge leap forward from Hipparcos to Gaia is especially visible in thewhite dwarf region of the diagram. While Hipparcos had obtained reliable distance measurements to only a handful of white dwarfs, more than 35 000 such objects are included in this diagram based on Gaia data. This allows astronomers to see the signature of different types of white dwarfs such that a differentiation can be made between those with hydrogen-rich cores and those dominated by helium. Acknowledgement: Gaia Data Processing and Analysis Consortium (DPAC); Carine Babusiaux, IPAG – Université Grenoble Alpes, GEPI – Observatoire de Paris, France. |
| التاريخ | |
| المصدر | http://www.esa.int/spaceinimages/Images/2018/04/Gaia_s_Hertzsprung-Russell_diagram |
| المؤلف | European Space Agency |
| الترخيص (إعادة استخدام هذا الملف) |
ESA/Gaia/DPAC,CC BY-SA 3.0 IGO |
| Title | Gaia’s Hertzsprung-Russell diagram |
| Mission | Gaia |
| Activity | Space Science |
ترخيص
- يحقُّ لك:
- مشاركة العمل – نسخ العمل وتوزيعه وبثُّه
- إعادة إنتاج العمل – تعديل العمل
- حسب الشروط التالية:
- نسب العمل إلى مُؤَلِّفه – يلزم نسب العمل إلى مُؤَلِّفه بشكل مناسب وتوفير رابط للرخصة وتحديد ما إذا أجريت تغييرات. بالإمكان القيام بذلك بأية طريقة معقولة، ولكن ليس بأية طريقة تشير إلى أن المرخِّص يوافقك على الاستعمال.
- الإلزام بترخيص المُشتقات بالمثل – إذا أعدت إنتاج المواد أو غيرت فيها، فيلزم أن تنشر مساهماتك المُشتقَّة عن الأصل تحت ترخيص الأصل نفسه أو تحت ترخيص مُتوافِقٍ معه.
تاريخ الملف
اضغط على زمن/تاريخ لرؤية الملف كما بدا في هذا الزمن.
| زمن/تاريخ | صورة مصغرة | الأبعاد | مستخدم | تعليق | |
|---|---|---|---|---|---|
| حالي | 14:05، 3 أبريل 2019 | | 2٬480 × 3٬754 (1٫46 ميجابايت) | Fæ | European Space Agency, Id 393151, http://www.esa.int/spaceinimages/Images/2018/04/Gaia_s_Hertzsprung-Russell_diagram, User:Fæ/Project_list/ESA |
استخدام الملف
الصفحة التالية تستخدم هذا الملف:
الاستخدام العالمي للملف
الويكيات الأخرى التالية تستخدم هذا الملف:
- الاستخدام في de.wikipedia.org
- الاستخدام في en.wikipedia.org
- الاستخدام في fr.wikipedia.org
- الاستخدام في ru.wikipedia.org
- الاستخدام في uk.wikipedia.org
- الاستخدام في zh.wikipedia.org