انتقل إلى المحتوى

ملف:MapEuropeSmall WattPerCapita 2014.svg

محتويات الصفحة غير مدعومة بلغات أخرى.
من ويكيبيديا، الموسوعة الحرة

الملف الأصلي (ملف SVG، أبعاده 401 × 420 بكسل، حجم الملف: 105 كيلوبايت)

ملخص

الوصف
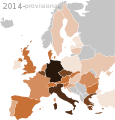
English: European photovoltaic deployment in 'watts per capita' by country as of the end of 2014. This map is part of an animation (PV per-capita distribution in Europe since 1992)

Legend: figures in watts per capita (inhabitant)

 
<0.1, n/a
 
0.1–1 watt
 
1–10 watts
 
10–50 watts
 
50–100 watts
 
100–150 watts
 
150–200 watts
 
200–300 watts
 
300–450 watts
 
450–600 watts
التاريخ

 
W3C-validity not checked.
 
.هذا الرسم المتجهي أُنشئ بواسطة Inkscape
المصدر

عمل شخصي Sourceː

Color changes in map for 2014 (watt-per-capita 2013→2014).
  • Cyprus 28 → 75.5 W/cap (not on map's scope)
  • Denmark: 97 → 107.4 W/cap
  • Germany 443 → 474.0 W/cap
  • Italy 299 → 308.4 W/cap
  • Luxembourg 172.8 → 200.1 W/cap
  • Malta 66.3 → 127.5 W/cap (not displayed on map)
  • Moldova none → 0.1 W/cap (G&G Solar 1, 330 kW PV project in Chisinau, 2 February 2014)
  • Netherlands 39 → 66.8 W/cap
  • Norway 0.1-1 → 2.6 W/cap
  • Serbia 0 → 0.1 W/cap (opening 1 MW solar park)
  • Switzerland 91 → 133.3 W/cap

Sources: IEA-PVPS, snapshot March 2015 and PV Barometer, April 2015:

Data table — Watts Per Capita Calculation In 2014
Country Capacity
2014
Added
2014
Popultaion Watts per
Capita
Austria Austria 766 140 8,477,00090.4
Belgium Belgium 3074 65 11,162,000275.4
Bulgaria Bulgaria 1,022 2 7,261,000140.8
Croatia Croatia 34.2 14.2 4,253,0008.1
Cyprus Cyprus 64.8 30 1,141,00075.5
Czech Republic Czech Republic 2,134 2 10,520,000202.9
Denmark Denmark 603 39 5,612,000107.4
Estonia Estonia 0.2 0.1 1,283,0000.6
Finland Finland 10 0 5,436,0001.9
France France 5,660 927 66,475,00085.1
Germany Germany 38,200 1,900 80,586,000474.0
Greece Greece 2,595 16 11,030,000235.3
Hungary Hungary 38.2 3.2 9,894,0003.9
Ireland Ireland 1.1 0.1 4,595,4000.7
Italy Italy 18,460 385 59,862,000308.4
Latvia Latvia 1.5 0 2,011,0000.8
Lithuania Lithuania 68.1 0.1 2,956,00023.1
Luxembourg Luxembourg 110 15 543,000200.1
Malta Malta 54 26 423,000127.5
Netherlands Netherlands 1,123 400 16,800,00066.8
Norway Norway 13 2 5,090,0002.6
Poland Poland 24 20 38,548,0000.7
Portugal Portugal 391 110 10,609,00036.9
Romania Romania 1,219 69 19,960,00061.1
Serbia Serbia  ?  ? 7,147,0000.x
Slovakia Slovakia 533 0.4 5,413,00098.5
Slovenia Slovenia 256 7.7 2,060,000124.2
Spain Spain 5,385 22 46,610,000115.5
Sweden Sweden 79 36 9,593,0008.2
Switzerland Switzerland 1,076 320 8,075,000133.3
Turkey Turkey 58 40 76,667,0000.8
Ukraine Ukraine (616) (290) 45,461,00013.6
UK United Kingdom 5,104 2,273 64,100,00079.6

Note: figures in parenthesis are still from the previous year (no data avail. yet)
Sources: capacity figures from IEA-PVPS and PV Barometer (URL see section "Summary")
Other European countries:

  • To be listed: Albania, Belarus, Bosnia, Iceland, Macedonia, Montenegro, Russia
  • Not in map's scope: Armenia, Azerbaijan, Cyprus, Faroe Islands, Georgia, Kazakhstan.
  • Not displayed on map: Andorra, Kosovo, Liechtenstein, Malta, Monaco, San Marino, Vatican.

Population figures: List of European countries by population and google service (sources include World Bank, 2013). Figures rounded. Likely to differ from those used in reports and may therefore be inconsistent with displayed W/cap-figures

المؤلف Rfassbind
إصدارات أخرى

This file is used as a frame in an animated GIF. For further information seeː

Europe WattPerCapita animated sequence since 1992

ترخيص

Public domain أنا، مالِك حقوق تأليف ونشر هذا العمل، أجعله في النِّطاق العامِّ، يسري هذا في أرجاء العالم كلِّه.
في بعض البلدان، قد يكون هذا التَّرخيص غيرَ مُمكنٍ قانونيَّاً، في هذه الحالة:
أمنح الجميع حق استخدام هذا العمل لأي غرض دون أي شرط ما لم يفرض القانون شروطًا إضافية.

الشروحات

أضف شرحاً من سطر واحد لما يُمثِّله هذا الملف

العناصر المصورة في هذا الملف

يُصوِّر

٧ مايو 2015

تاريخ الملف

اضغط على زمن/تاريخ لرؤية الملف كما بدا في هذا الزمن.

زمن/تاريخصورة مصغرةالأبعادمستخدمتعليق
حالي10:01، 7 مايو 2015تصغير للنسخة بتاريخ 10:01، 7 مايو 2015401 × 420 (105 كيلوبايت)Rfassbindretroactive change for Lithuania (>10) as per PV Barometer report (23 W/cap for 2013 and 2014)
09:43، 7 مايو 2015تصغير للنسخة بتاريخ 09:43، 7 مايو 2015401 × 420 (105 كيلوبايت)RfassbindAdjusted to actual figures from PV Barometer report. Color changes for W/cap: downgraded CRO (<10), upgraded LUX (>200). Removed estimate mark (e) from map.
22:49، 23 أبريل 2015تصغير للنسخة بتاريخ 22:49، 23 أبريل 2015401 × 420 (105 كيلوبايت)RfassbindAdjusted to actual figures from IEA-PVPS snapshot (Apr 2015) report. Color changes for W/cap: downgraded UK (<100), Austria (<100), and Slovakia (<100). Upgraded Norway (>1). Confirmed: DEN (>100), GER (>450), ITA (>300), NLD (>50), SWI (>100).
22:08، 17 نوفمبر 2014تصغير للنسخة بتاريخ 22:08، 17 نوفمبر 2014401 × 420 (105 كيلوبايت)RfassbindAdded Norway and Moldova as they (most likely) crossed 0.1 W/cap (NOR: opening solar park in Vestby, Oct 7th, 2014, and Moldova: G&G Solar 1 completes the implementation of its 330 kW PV project in Chisinau, Feb 2nd, 2014).
10:22، 16 نوفمبر 2014تصغير للنسخة بتاريخ 10:22، 16 نوفمبر 2014401 × 420 (105 كيلوبايت)Rfassbindest 2014 - added Serbia (opening solar park in Beočin)
15:40، 12 نوفمبر 2014تصغير للنسخة بتاريخ 15:40، 12 نوفمبر 2014401 × 420 (105 كيلوبايت)Rfassbind{{Information |description={{en|1=Provisional estimate of European photovoltaic deployment in 'watts per capita' by country as of the end of 2014, based on last years figures and estimated deployments in 2014.}} '''Legend:''' figures in watts per inha...

الصفحة التالية تستخدم هذا الملف:

الاستخدام العالمي للملف

الويكيات الأخرى التالية تستخدم هذا الملف:

بيانات وصفية