
ملف:Projected changes in crop yields at different latitudes with global warming.png
الملف الأصلي (1٬322 × 694 بكسل حجم الملف: 16 كيلوبايت، نوع MIME: image/png)
| هذا ملف من ويكيميديا كومنز. معلومات من صفحة وصفه مبينة في الأسفل. كومنز مستودع ملفات ميديا ذو رخصة حرة. |
ملخص
| الوصف |
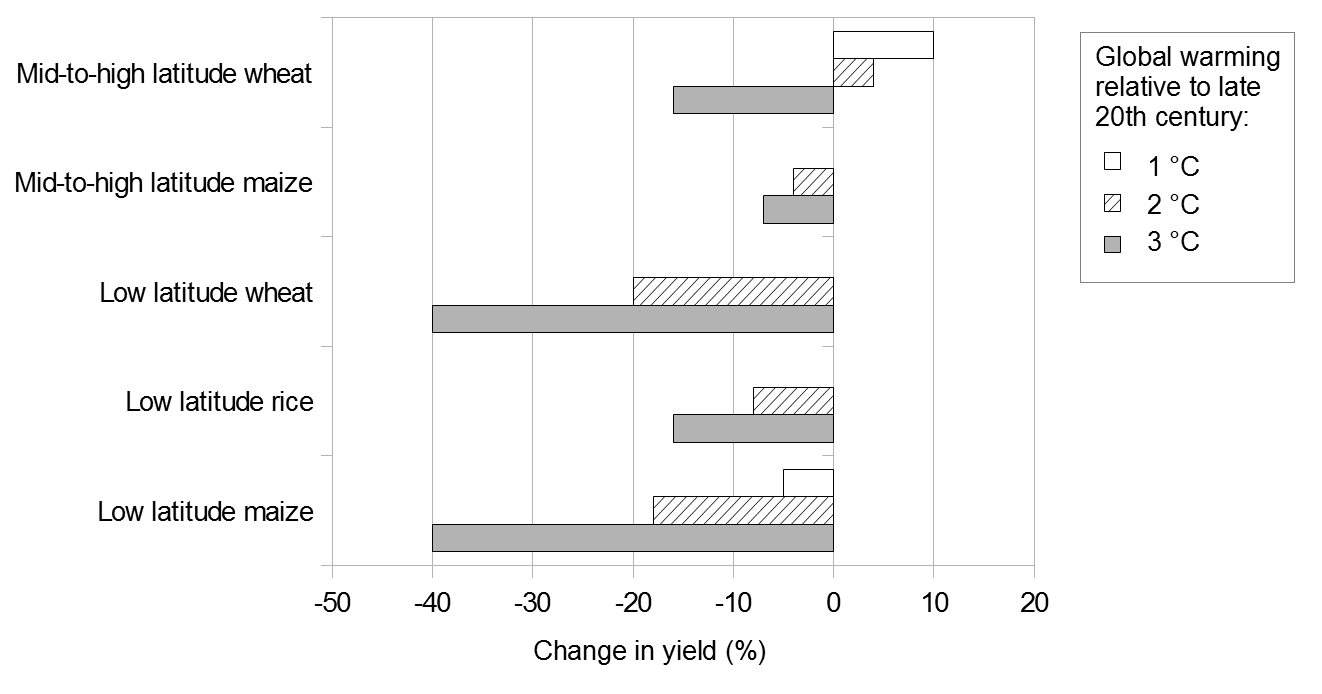
English: This bar graph shows projected changes in crop yields at different latitudes with global warming. Projected changes are shown for 1-3 °C of global warming, relative to late 20th century. For mid-to-high latitudes, changes in yield are shown for wheat and maize. For low-latitudes, changes are shown for wheat, rice and maize. In mid-to-high latitudes:
In low latitudes:
Data Values are approximate and are taken from the US National Research Council (US NRC, 2011).[1] The first, second and third numbers are the projected changes in yields (%) for 1, 2 and 3 °C of global warming, respectively.:
US NRC (2011)[1] drew on several studies. The graph does not show the "likely" ranges included in US NRC (2011).[1] The likely range means that there is a 67% chance of the projected change in yield being correct, based on expert judgement.[1] For 1 °C of global warming, the likely range is roughly equal to plus or minus (+/-) 10% for all projected changes in yields. Uncertainty increases with temperature. For 3 °C of warming, the likely range is roughly:
These projections broadly show the probable changes in regional yields.[2] The projections do not include measures to adapt to global warming.[2] Actual changes in yields may vary according to local conditions.[2] There are numerous other uncertainties, including how local climate will change with global warming, and the atmospheric concentration of carbon dioxide (CO2) associated with different magnitudes of global warming.[2] There is also the possibility that yields will change if critical thresholds are crossed.[2] Many of the uncertainties could bias the projections towards underestimating reductions in crop yields.[2] However, adaptation practices could help to reduce losses in yields.[2] Adaptation will be more difficult for higher magnitudes of warming, and may be less effective in tropical regions.[2] Notes
References
|
| التاريخ | |
| المصدر | عمل شخصي |
| المؤلف | Enescot |

|
هذه graph الصورة / الصورتان باستعمال رسومات متجهية ملفات رسوميات شعاعية.
It is recommended to name the SVG file "Projected changes in crop yields at different latitudes with global warming.svg" - then the template Vector version available (or Vva) does not need the new image name parameter.
|
Comma-separated values
Data were exported from OpenOffice.org 3.4.1 Calc as comma-separated values (csv). The following options were used:
- Character set: Western Europe 1252
- Field delimiter: ,
- Text delimiter: "
- Quote all text cells: no
- Save cell content as shown: yes
- Fixed column width: no
,,,,,,
,,,,,,
,,,Global warming relative to late 20th century,,,
,,Region and crop,1,2,3,
,,Mid-to-high latitude wheat,10,4,-16,Changes in yield (%)
,,Mid-to-high latitude maize,0,-4,-7,
,,Low latitude wheat,0,-20,-40,
,,Low latitude rice,0,-8,-16,
,,Low latitude maize,-5,-18,-40,
ترخيص
| هذا الملف متوفر تحت ترخيص المشاع الإبداعي CC0 1.0 الحقوق العامة. | |
| لقد وَضَعَ صاحب حقوق التَّأليف والنَّشر هذا العملَ في النَّطاق العامّ من خلال تنازُلِه عن حقوق العمل كُلِّها في أنحاء العالم جميعها تحت قانون حقوق التَّأليف والنَّشر، ويشمل ذلك الحقوق المُتَّصِلة بها والمُجاورة لها برمتها بما يتوافق مع ما يُحدده القانون. يمكنك نسخ وتعديل وتوزيع وإعادة إِنتاج العمل، بما في ذلك لأغراضٍ تجاريَّةٍ، دون حاجةٍ لطلب مُوافَقة صاحب حقوق العمل.
|
تاريخ الملف
اضغط على زمن/تاريخ لرؤية الملف كما بدا في هذا الزمن.
| زمن/تاريخ | صورة مصغرة | الأبعاد | مستخدم | تعليق | |
|---|---|---|---|---|---|
| حالي | 13:25، 21 يوليو 2013 | | 1٬322 × 694 (16 كيلوبايت) | Enescot | {{Information |Description ={{en|1=This bar graph shows projected changes in crop yields at different latitudes with global warming. Projected changes are shown for 1-3&n... |
استخدام الملف
الصفحتان التاليتان تستخدمان هذا الملف:
الاستخدام العالمي للملف
الويكيات الأخرى التالية تستخدم هذا الملف:
- الاستخدام في bn.wikipedia.org
- الاستخدام في en.wikipedia.org
- الاستخدام في mk.wikipedia.org
- الاستخدام في nl.wikipedia.org
- الاستخدام في zh.wikipedia.org