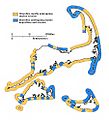
ملف:Deposition erosion.jpg
المظهر

حجم هذه المعاينة: 546 × 600 بكسل. الأبعاد الأخرى: 218 × 240 بكسل | 437 × 480 بكسل | 900 × 989 بكسل.
الملف الأصلي (900 × 989 بكسل حجم الملف: 113 كيلوبايت، نوع MIME: image/jpeg)
تاريخ الملف
اضغط على زمن/تاريخ لرؤية الملف كما بدا في هذا الزمن.
| زمن/تاريخ | صورة مصغرة | الأبعاد | مستخدم | تعليق | |
|---|---|---|---|---|---|
| حالي | 22:40، 10 أكتوبر 2016 |  | 900 × 989 (113 كيلوبايت) | Grolltech | Anisotrophic filter to smooth noise, larger image; shift colors for better accessibility to colorblind persons. |
| 00:48، 30 أغسطس 2011 |  | 600 × 659 (66 كيلوبايت) | Grolltech | Added color to the original black & white diagram, to more clearly indicate areas of erosion and deposition. | |
| 13:16، 11 سبتمبر 2009 |  | 600 × 659 (112 كيلوبايت) | Grolltech | {{Information |Description={{en|1=Map of Cape Cod showing shores undergoing erosion (cliffed sections) and shores characterized by marine deposition (barriers). Although the barriers are sites of marine deposition, in the long run, the ocean shore will re |
استخدام الملف
الصفحة التالية تستخدم هذا الملف:
الاستخدام العالمي للملف
الويكيات الأخرى التالية تستخدم هذا الملف:
- الاستخدام في ca.wikipedia.org
- الاستخدام في cs.wikipedia.org
- الاستخدام في en.wikipedia.org
- الاستخدام في es.wikipedia.org
- الاستخدام في sl.wikipedia.org


