
ملف:Global temperature relative to peak Holocene temperature, based on ocean cores (NASA).png
حجم هذه المعاينة: 800 × 433 بكسل. الأبعاد الأخرى: 320 × 173 بكسل | 640 × 347 بكسل | 1٬024 × 555 بكسل | 1٬280 × 693 بكسل | 3٬486 × 1٬888 بكسل.
الملف الأصلي (3٬486 × 1٬888 بكسل حجم الملف: 193 كيلوبايت، نوع MIME: image/png)
| هذا ملف من ويكيميديا كومنز. معلومات من صفحة وصفه مبينة في الأسفل. كومنز مستودع ملفات ميديا ذو رخصة حرة. |
.png)
ملخص
| الوصف |
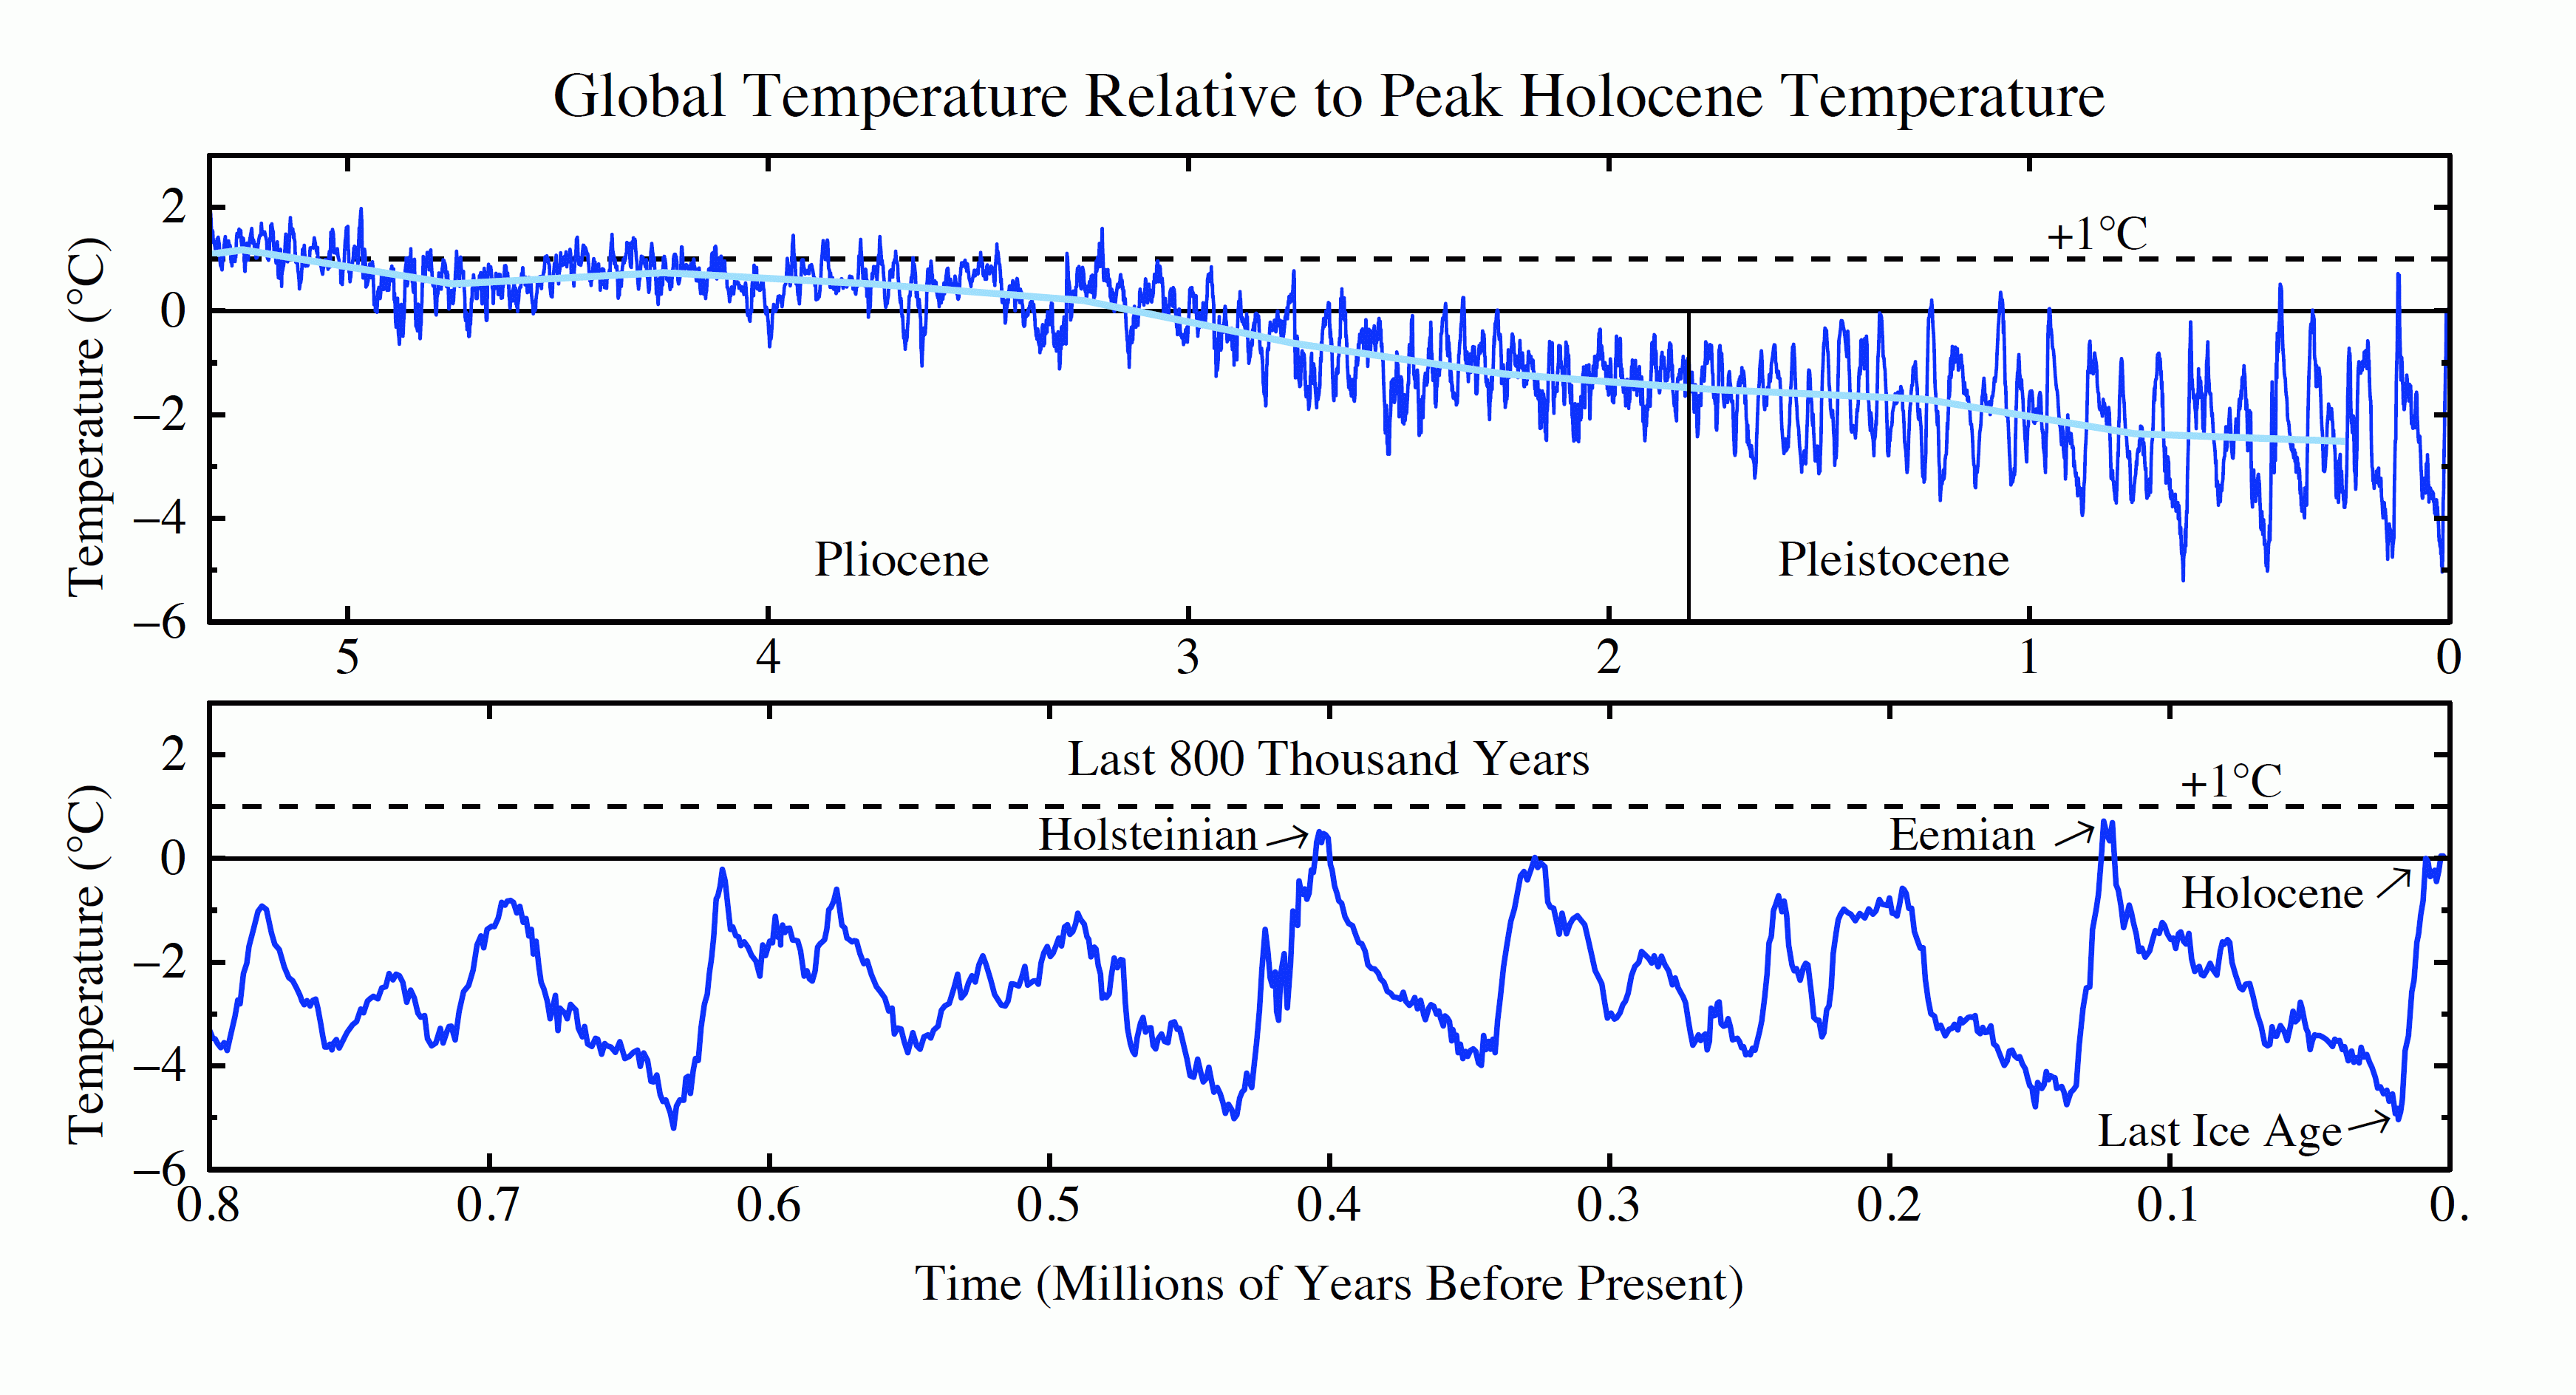
English: These two graphs show global temperatures for two different time periods (Hansen and Sato, 2011). The top graph shows global surface temperature for the past 5.3 million years as inferred from cores of ocean sediments taken all around the global ocean. The last 800,000 years are expanded in the bottom graph. From the cited public-domain source (Hansen and Sato, 2011): "Assumptions are required to estimate global surface temperature change from deep ocean changes, but we argue and present evidence that the ocean core record yields a better measure of global mean change than that provided by polar ice cores. Civilization developed during the Holocene, the interglacial period of the past 10,000 years during which global temperature and sea level have been unusually stable. (This image) shows two prior interglacial periods that were warmer than the Holocene: the Eemian (about 130,000 years ago) and the Holsteinian (about 400,000 years ago). In both periods sea level reached heights at least 4-6 meters (13-20 feet) greater than today. In the early Pliocene (around 3 million years ago) global temperature was no more than 1-2°C warmer than today, yet sea level was 15-25 meters (50-80 feet) higher." |
| التاريخ | |
| المصدر | fig1.pdf, in: NASA GISS: Science Briefs: Earth's Climate History: Implications for Tomorrow[1], New York City, New York, USA: NASA GISS, (Please provide a date or year), archived from the original on 2011-07-24 |
| المؤلف | James E. Hansen and Makiko Sato |
ترخيص
| يقع هذا العمل في النِّطاق العامّ في الولايات المُتحدة الأمريكيَّة لأَنَّه عملٌ خالِصٌ من إِنتاج وكالة الفضاء الأمريكيَّة. تنصُ حقوق التَّأليف والنَّشر الخاصَّة بوكالة الفضاء الأمريكيَّة على أنَّ "أعمال الوكالة غير مَحميَّة بحقوق التَّأليف والنَّشر ما لم يُذكر خلافُ ذلك". لمزيدٍ من المعلومات انظر القالِب {{PD-USGov}} وصفحة حقوق التَّأليف والنَّشر الخاصَّة بالوكالة وصفحة سياسة الصُّور الخاصَّة بمُختبر الدَّفع النَّفَّاث. | ||
 |
تنبيهات:
|
تاريخ الملف
اضغط على زمن/تاريخ لرؤية الملف كما بدا في هذا الزمن.
| زمن/تاريخ | صورة مصغرة | الأبعاد | مستخدم | تعليق | |
|---|---|---|---|---|---|
| حالي | 03:14، 20 نوفمبر 2012 | | 3٬486 × 1٬888 (193 كيلوبايت) | Enescot | {{Information |Description ={{en|1=These two graphs show global temperatures for two different time periods (Hansen and Sato, 2011). The top graph shows global surface temperature for the past 5.3 million years as inferred from cores of ocean [[:en:... |
استخدام الملف
الصفحتان التاليتان تستخدمان هذا الملف:
الاستخدام العالمي للملف
الويكيات الأخرى التالية تستخدم هذا الملف:
- الاستخدام في de.wikipedia.org
- الاستخدام في no.wikipedia.org
.png)